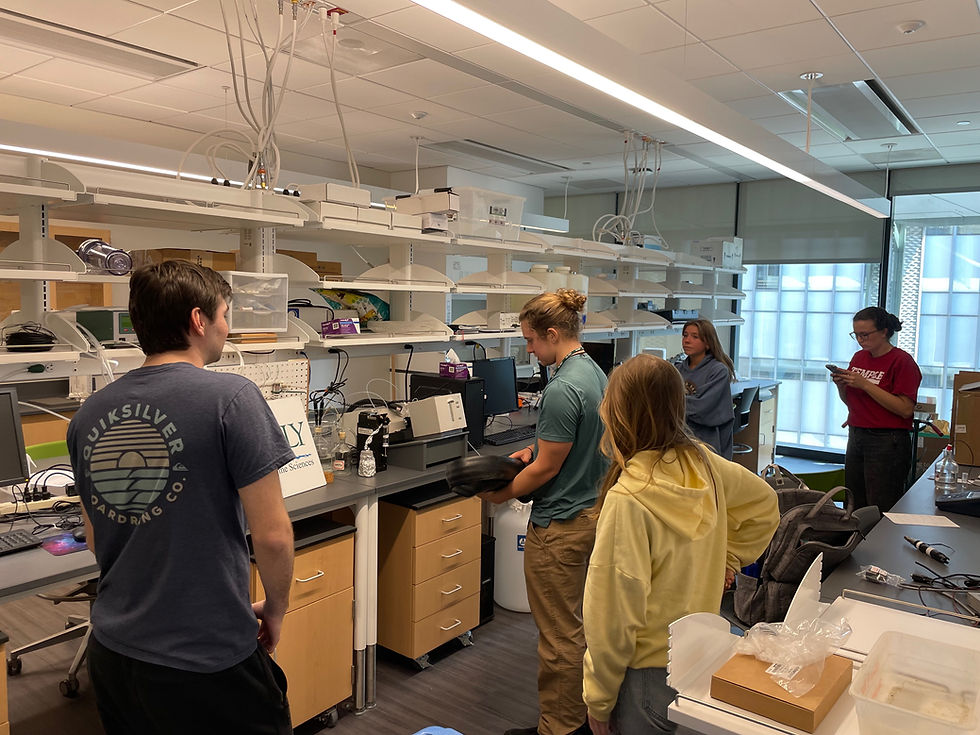
Avila Pier Sampling Day 01 Cast 01
- bockmon
- Sep 30, 2017
- 1 min read

Another beautiful morning on the pier! But this time, samples and data to explore instead of sea lions and whales.
My lab has a joint sampling project with Dr. Pasulka's (a biological oceanographer), to examine the temporal variability of the vertical depth profile of chemical and biological parameters at the Avila Pier. Today was the beginning.

Our students launch the Cal Poly CTD (conductivity, temperature, and depth) instrument and gather water samples at different depths. The samples are processed and stored to be analyzed later for a whole suite of measurements like pH, total dissolved carbon, alkalinity, nutrients, oxygen, chlorophyll, and genetic information.
In real time (while the instrument is in the water), we can see data for some physical parameters on a computer that the instrument is attached to. The green data on the plot to the left indicates the temperature; starting just above 16 C at the surface, and decreasing to just above 14C near the bottom. There are two sets of green data, because the instrument records while the CTD is lowered to the bottom, and while it is brought back to the surface. At the end of the pier where we sample, the water is about 10m deep.


Comments